Understanding the Visualizer
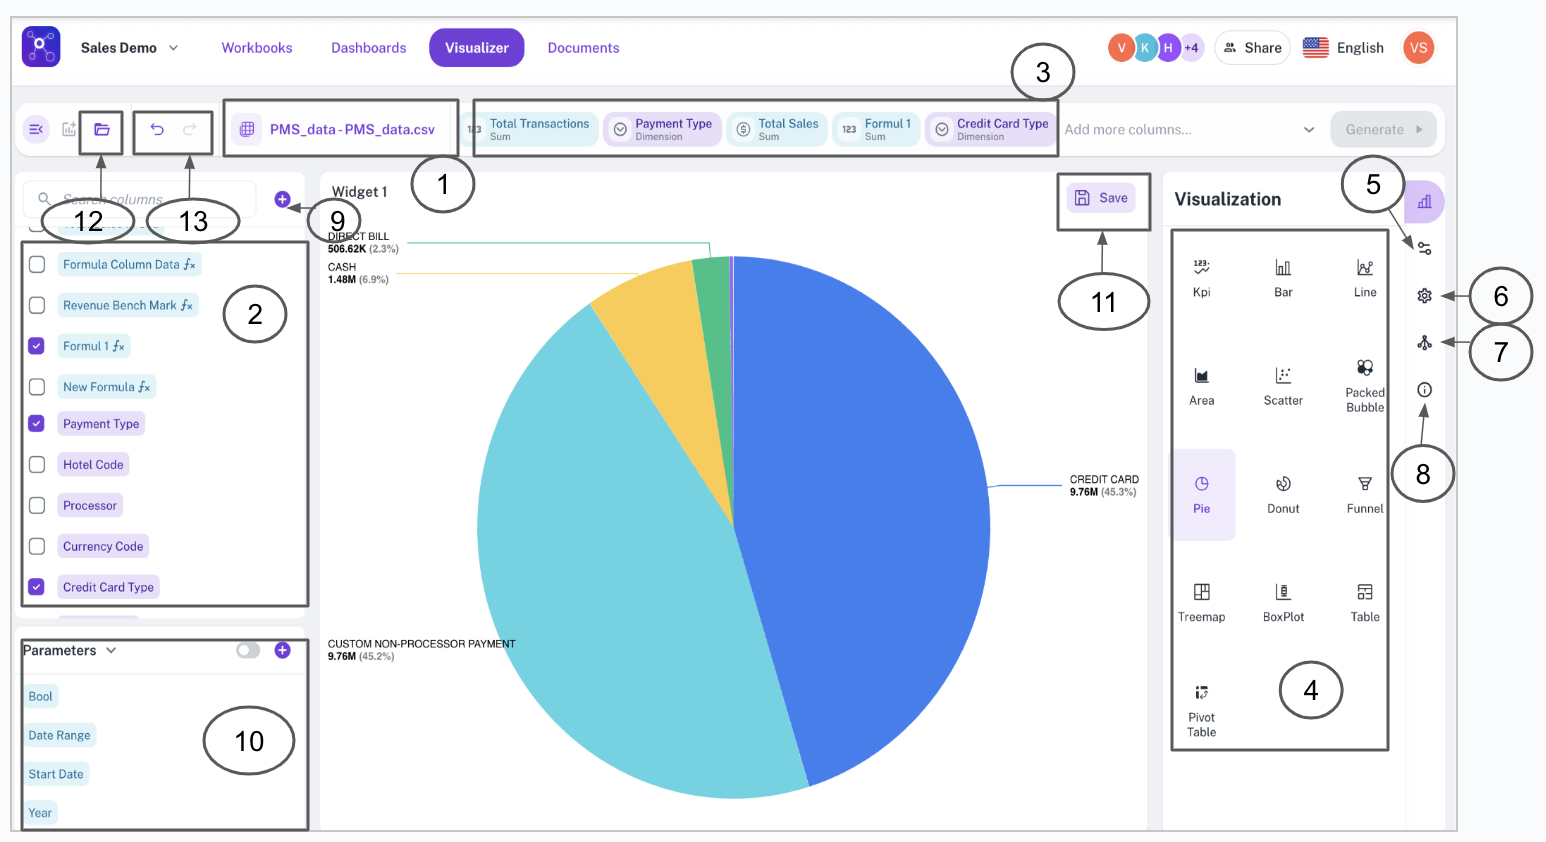
This topic introduces the user interface (UI) for data visualization. It describes the individual components of the visualizer's interface and explains the function of each part. Each of the functions are referenced to the corresponding topics.
| No. | Item | Description | Reference |
|---|---|---|---|
| 1 | Workbook selection | From the Workspaces, either select or add a workbook to begin your analysis. | How to add a workbook |
| 2 | Auto-populated columns | Columns from the selected workbook are automatically displayed for selection. | |
| 3 | Column selection | Add columns to the search bar to include them in your visualization. | Learn more about selecting columns |
| 4 | Visualization type | Easily switch between different visualization types (e.g., bar, pie, line) to best represent your data. | Learn more about visualization types |
| 5 | Configuration panel | Fine-tune your widget’s configuration. | Widget types and configurations |
| 6 | Settings panel | Modify the widget’s title, subtitle, and help message for better understanding. | Widget types and configurations |
| 7 | Drill-down | Configure drill-down layers to explore data in more detail. | Learn about drill-down |
| 8 | Details panel | View the SQL query behind your widget for transparency and troubleshooting. | Learn about Details panel |
| 9 | Add formulas | Create custom formulas for advanced BI calculations. | Understanding formulas on BI |
| 10 | Add parameters | Use parameters to make your BI platform more dynamic and interactive. | Understanding parameters on BI |
| 11 | Save widget/visualization | Pin to dashboard: Add your widget to a dashboard for easy access. Save as draft: Save your work-in-progress for later editing. | Learn about pinning a visualization, Learn about creating drafts |
Also see:
Was this helpful?